Builder Blocks Indicator Course Goal


My goal is to bring you to a level of proficiency which will permit you to read or write your own modestly sophisticated NinjaTrader® indicators and eventually strategies. A NinjaTrader® script is composed of many common components which include coloring the price bars based on given criteria, shading the background based on given criteria, calling another indicator, plotting an additional moving average, plotting an arrow or other object on the chart, adding a parameter to the user dialog box, adding an alert and being able to view the internals of your indicator during execution time without having to learn how the use the complicated debugger. To make it easy to understand and code each of these components, we have created lessons for each.  Once understood it becomes a straight forward cut and paste of the sections of code in the lessons into your specific indicator. Creating indicators is repetative in nature and each of these common components is described in detail in our lessons. Its is our goal to provide you an excellent foundation to work from.


What is included in the Course

We have created a number of classes which have been rolled into a course for each builder block component and described in miniut detail how to make the changes, including what is affected.  Each lesson has a base starting script so a student may repeat the exercise themselves and a final script with the complete solution. 

There is much more to learn about programming in C# after you complete the lessons provided. There really is no graduation or finish line when it comes to programming. Programming requires a commitment to learn and a dedication to truly become proficient. We welcome the opportunity to start you on your way with an excellent foundation when you have completed our class sessions.


 Builder Blocks Indicator Course Overview

The Overview module reviews all the major components of a NinjaScript Indicator. Particular attention is paid to explaining the "why's" and "how come" of each region, class, or function. Although no programming is performed in this overview, a very good foundation is created to enable moving on to the programming in the following lessons.

The biggest problem for me when I began programming the NinjaScript language, was that there free-sampleswas no overall big picture description of the internals of an indicator script anywhere to be found. This overview will save time and big fustrations for anyone starting to learn the art of NinjaScript programming.

To watch this Overview for FREE register on the home page. The Builder Blocks Course Overview is almost 30 minutes in duration and is based on the standard NinjaTrader SMA Indicator. Open it up and follow along. It is 95% content with minimal marketing.  Enjoy!


unit01Modification of a simple Indicator.                                                           

The intent of Lesson 1 is all about environment. While we will add our first parameter to the user input dialog box for the SMA indicator, will be also mostly getting comfortable editing, renaming, compiling, and viewing results in the output window. The added variable will be added to the Variables Region. Most importantly we will get our first taste how to debug an indicator by using the standard Print statement and the output window. No need of a C# debugger. In addition, we will timestamp each printed row to the output window allowing you so see the contents of variables the indicator during execution. Lastly, we will add text to the top of the chart. As an overview, this foundation lesson not only explains how to compile an indicator, the types of files you can receive an indicator in and how to import or which directories to place the NinjaTrader Script files to.  We go to great lengths to explain the various parts of the indicator so nothing remains unclear. 

Lesson 1 is available in video flash video format. The instructional video has the instructor going through in miniut detail all aspects required to complete the above tasks. This lesson includes with a base script to start from when you try the exercise yourself. The completed solution script is also provided.  This lesson only adds about 15 lines of code but is over an hour in length. It is in the same format as the free Overview Video available for viewing on the home page.  ($99.00 USD)  Canadian Residents will be required to pay the HST.

 ALL SALES FINAL

unit02Add an additional moving average to the chart.

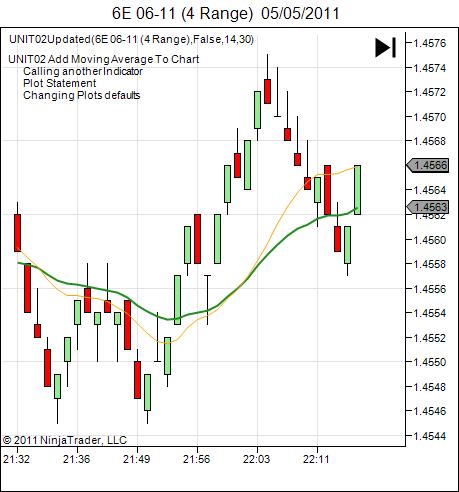
On completion of lesson 2 we will have added an additional moving average to the indicator, which will be plotted on the price chart. To accomplish this task we learn how to call another indicator and store its results for assignment to the new plotted moving average.  Calling another indicator is documented in the help. However, you never really know on more complicated indicators which parameters need to be included in the call to the indicator. We show you a very easy way, a non documented way, to know the exact what parameters that are necessary in the calling indicator string. No more guess work about which order and which parameters.Additionally, we will spend time on the PLOT statement and speak to the new dataseries created to plot the new moving average. We also review the changing of the defaults on the PLOT statement.

 Adding the choice of which Moving Average to Plot on the Price Chart.

In the previous lesson we added a moving average to the chart. In lesson 3  we will provide the user of the indicator the choice of which moving average type plot in the user dialog box. This selected moving average will be plotted on the Price chart. We will learn about the enum C# function and switch statement ( which is a C# case statement). Finally, we will spend more time on the PLOT statement.

Just a note on the enum function used in NinjaScript Indicators. It is a great feature to allow the user to select from a list but internally there is a fair but going on, which will be explained in detail. If you have ever tried to save an indicator which has an enum as another name, on compilation you will get errors relating to a duplicate name. In this lesson, we will show you how to get around this problem.  

 Adding an Alert to an Oscillator.

This lesson teaches us how to add a number of parameters to the Variables and Properties Regions and to define the WAV files and flags to turn the audio on and off, depending on the criteria the user selected in the user dialog box. We will talk about Historical bars and how our indicator should avoid alerting us on those historical bars. We will also add a horizontal line to our oscillator for the zero line.  In addition, we will demonstrate how to create your own personal ALERT WAV file using a FREE utility. The Alert will say: "CL 200 CCI alert" in our example but it could be anything of your choosing. We will learn and use the following reserved words: PlaySound, Historical, Overlay parameter, and Line plot.

Adding an alert to an indicator was the very first inidcator modification I wanted to do on the NinjaTrader platform. We believe this lesson will make it very easy for someone to be able to do so, especially with the background material we have already covered.

 Adding Rising, Falling, and Neutral Colors for a Moving Average

This lesson will teach us to create three individual plot lines to color code the moving average. We will use the reserved words Rising and Falling. Also, we will cover some of the not so clear reasons to plot 1 bar back on a color change. There are many sophisticated methods to plot a moving average colours depending on whether the average is rising or falling. In this lesson we will restrict ourselves to the basic manner to do so as the other methods are to complex at this point.


 How to shade background on Price Chart based on a Rising or Falling Oscillator

This lesson will teach us to modify the very popular and my favourite indicator the SuperTrend.  The SuperTrend indicator shows the changing of trend based on the sensitivity settings of a computed Average True Range. The bars on the chart change from long to short once the price goes through the volatility stop. In this lesson we will call the MACD oscillator and depending if it average is rising or falling we will paint the background one color or another. This exercise will allow us to be able to provide the user the ability to select their own colors for the background, for the longs and the shorts. When we use the built in Plot functions this colour serialization occurs automatically for us. However, in this case we must do additional coding to provide the user the ability to select from the available color list in NinjaTrader. It can appear confusing at first but not after you have someone explain the how and the why.


Color the Price Bars.

This lesson teaches us to call an indicator, the ADX indicator in our example, and tracks whether it is rising or falling. When Rising we wish to paint the color of the bars Blue and when Falling would like paint the bars Magenta. Otherwise, when the ADX is falling we paint the bars Gray. This sounds all well and good but anyone that has used the ADX will know that the ADX rises in both cases, on a long push and on a short push. So how do we distinguish between long and short colors for the bars using the ADX. Follow along on this lesson to see how we can do so.


All journeys start with a first step. Start your NinjaTrader programming learning with a solid foundation!